

By: Paxton Welton and Nick Ruhs


Introduction
“Data is the sword of the 21st century. Those who wield it, the samurai.”-Jonathan Rosenberg
Data is all around us and we often interact with it in ways we don’t even realize. From using an app to mobile order our coffee to reviewing a chart provided in an article, data surrounds us and has become so intertwined with our lives. However, with the increasing amount of data available at our fingertips, it can be difficult to understand its meaning, accuracy, and relevance to our lives. This is the reason we decided to start this new blog series, Get Data Lit! We realize that data can be difficult to decipher and want to give you the tools to better navigate data you are faced with everyday.
What is data and data literacy?
Before we dive into some data examples and how to evaluate them, we need to talk about data and data literacy and what those phrases actually mean.
It is important to realize that data can mean vastly different things in different contexts. For our purposes, we will use a general definition of data. Merriam-Webster’s dictionary defines data as “factual information (such as measurements or statistics) used as a basis for reasoning, discussion, or calculation.” To put it more simply, data can be thought of as pieces of information. These pieces of information only have meaning once they are analyzed or used to make calculations or draw conclusions. This concept of data as information is a major reason why data literacy is so important. Data literacy is the ability to consume knowledge, produce coherently and think critically about data. Understanding the basics of data literacy will allow you to evaluate data based on its factual merit, irrespective of the context in which you find the data. You will be able to decipher the data behind the stories that you see in the media, as well as other data that you interact with daily in your coursework, research endeavors, and community activities.
How can you use data literacy to understand real-world issues?
In order to demonstrate the application of data literacy, we decided to walk through a couple of “real-world” data examples. We chose to focus on data related to the COVID-19 pandemic. Throughout the pandemic, we have been inundated with data and statistics explaining the issue from a variety of sources. A lot of COVID-19 data we are seeing comes in the form of charts, graphs or infographics and knowing how to critically evaluate those will help you bring meaning to the data.
When critically evaluating the data presented in a graph, there are a few things we should look out for. These include:
- Title: What does the data in this graph represent?
- Labeled axis: What do the values on each axis represent? What is the relationship between the two axes?
- Methodology: What kind of analysis was performed on this data? How did this analysis produce the final graph? (NOTE: You may need to reach the associated article or news piece to find this information.)
- Key (definitions): Is there a legend or text box that describes what each set of data points represents and matches them to their respective colors?
- Source: Is there a link back to the original dataset or raw data? Is the graph an accurate representation of that data?
- Date: When was the original data collected? Does this graph represent that?
Using these general concepts, we can take a critical look at some representations of recent COVID-19 data and decipher the purpose and meaning of the data. We will touch on these concepts as part of our analysis below.
Graph 1

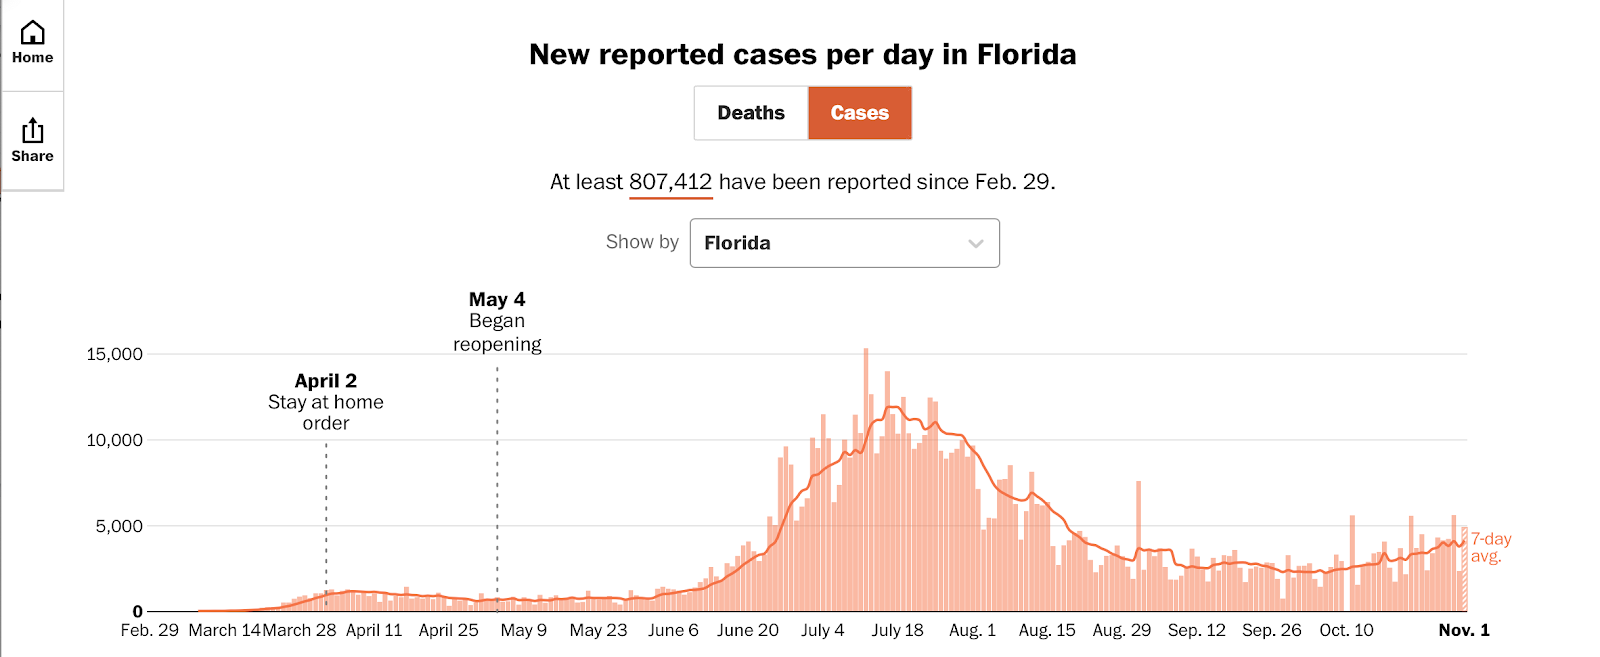
Overview: The above graph, obtained on November 1st from The Washington Post, shows newly reported COVID-19 cases per day in the state of Florida. The x-axis of the graph represents a range of dates from March 1st through November 1st and the y-axis represents the number of new cases reported daily. The data shown in this graph was obtained from Washington Post reporting, Johns Hopkins University, and local governmental departments of health. The graph also contains the dates the stay at home order and reopening began in the state of Florida.
Analysis: This graph allows us to visually see where the state of Florida is at in regards to flattening the COVID-19 curve. This graph gives us a thorough and detailed visualization of positive Florida COVID-19 cases throughout the entirety of the pandemic. This graph allows us to see the progression of COVID-19 cases and that positive cases are beginning to move upward again in the state of Florida.
Graph 2

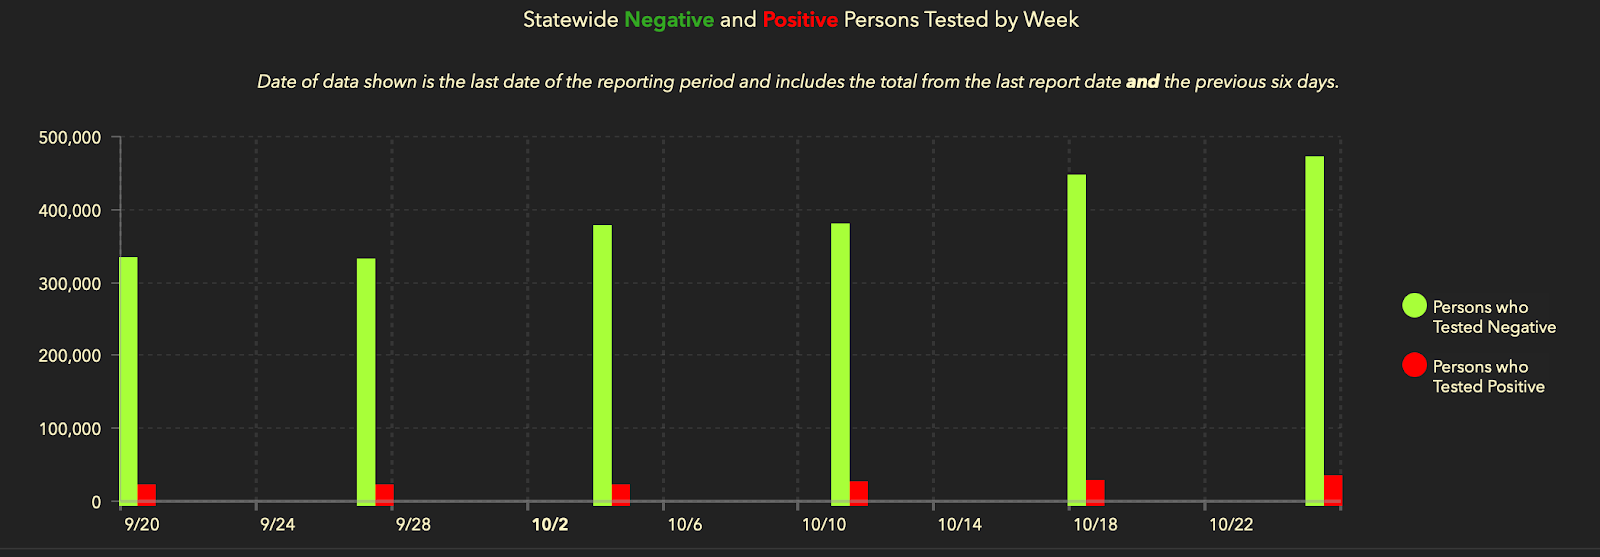
Overview: The above graph, obtained on November 1st from the Florida Department of Health, shows the number of people who tested negative and the number of persons who tested positive for COVID-19 in the state of Florida from 9/20 through 10/22. The x-axis of the graph represents a set of dates and the y-axis represents the number of persons tested. The data in the graph above was obtained from the Florida Department of Health COVID-19 dashboard. The green bars in the chart represent persons who tested negative and the red bars in the chart represent the persons who tested positive.
Analysis: This graph shows us both positive and negative test results in the state of Florida in increments of seven days over one month. However, the data is represented by a bar chart, with large gaps between each data point. in a way that is not as easy to digest and make sense as a viewer. Also, the number of persons tested (y-scale) is represented in increments of 100,000, which in this case distorts the total number of negative and positive tests. The red bars, representing positive tests, look small in comparison to the green bars, representing total negative tests.Representing the data in this way may leave the viewer with a false assumption that total positive cases in the state are decreasing.
Comparison of the two graphs
Both of these graphs show us the amount of positive COVID-19 cases in Florida but in two very different ways. The first graph paints a thorough picture of where the state of Florida is at in terms of COVID-19 cases. By presenting the data throughout the entirety of the pandemic and clearly defining the data points represented in the graph, viewers are able to easily understand the current trend of COVID-19 in Florida. However, the data visualized in the second graph is less clear. Presenting the data as a bar chart makes it harder for the viewer to evaluate current trends related to the number of positive and negative COVID-19 tests within a certain time period . Also, since the number of positive cases is a very small percentage of overall cases, the y-scale should be adjusted accordingly. Overall, by viewing these two examples, one can conclude that the way in which data is represented and defined is a key component to consider when evaluating the data.
Conclusion
As the COVID-19 pandemic continues, new data will continue to be released through the news media, social media, and various scholarly sources. We hope that the two examples above and our brief analysis has equipped you with the knowledge and skills to more critically evaluate the credibility and authority of data as it is released. That being said, these skills will be of critical importance even beyond COVID-19. Data plays an integral part in all facets of our lives, and thus data literacy skills will be critical for understanding and interacting with data in your everyday life.
If you’re interested in learning more about data literacy or the resources FSU Libraries offers to assist you with your data needs, feel free to visit the data services at FSU Libraries website. We also host the Data @ your Desk series, which offers a variety of workshops on data analysis and visualization tools and methods. Feel free to check out the upcoming workshop listings by clicking here.
Biographies
Paxton Welton is the STEM Research Data Services Assistant. She assists with outreach and education to STEM students, groups, and organizations at Florida State University around STEM research data services.
Dr. Nick Ruhs is the STEM Data and Research Librarian at Florida State University. He leads the development of data services for STEM scholars and provides support on topics related to research data management and data information literacy. He is also the subject librarian for the Chemistry, Biological Sciences, Statistics, Computer Science, and Scientific Computing departments.
Sources
The Washington Post. U.S. Coronavirus cases and state maps: tracking cases and deaths. Retrieved November 1, 2020. https://www.washingtonpost.com/graphics/2020/national/coronavirus-us-cases-deaths/
Glusker, A. (2017). Data Literacy: What It Is and Why You Should Care. Network of the National Library of Medicine. https://news.nnlm.gov/pnr/data-literacy-what-it-is-and-why-you-should-care/
Florida Department of Health. Florida’s COVID-19 Data and Surveillance Dashboard. Retrieved November 1, 2020. https://experience.arcgis.com/experience/96dd742462124fa0b38ddedb9b25e429